Wind Rose
API: Weather API
This example shows how to build a wind rose from the Rainbow Weather API's 48-hour hourly forecast.
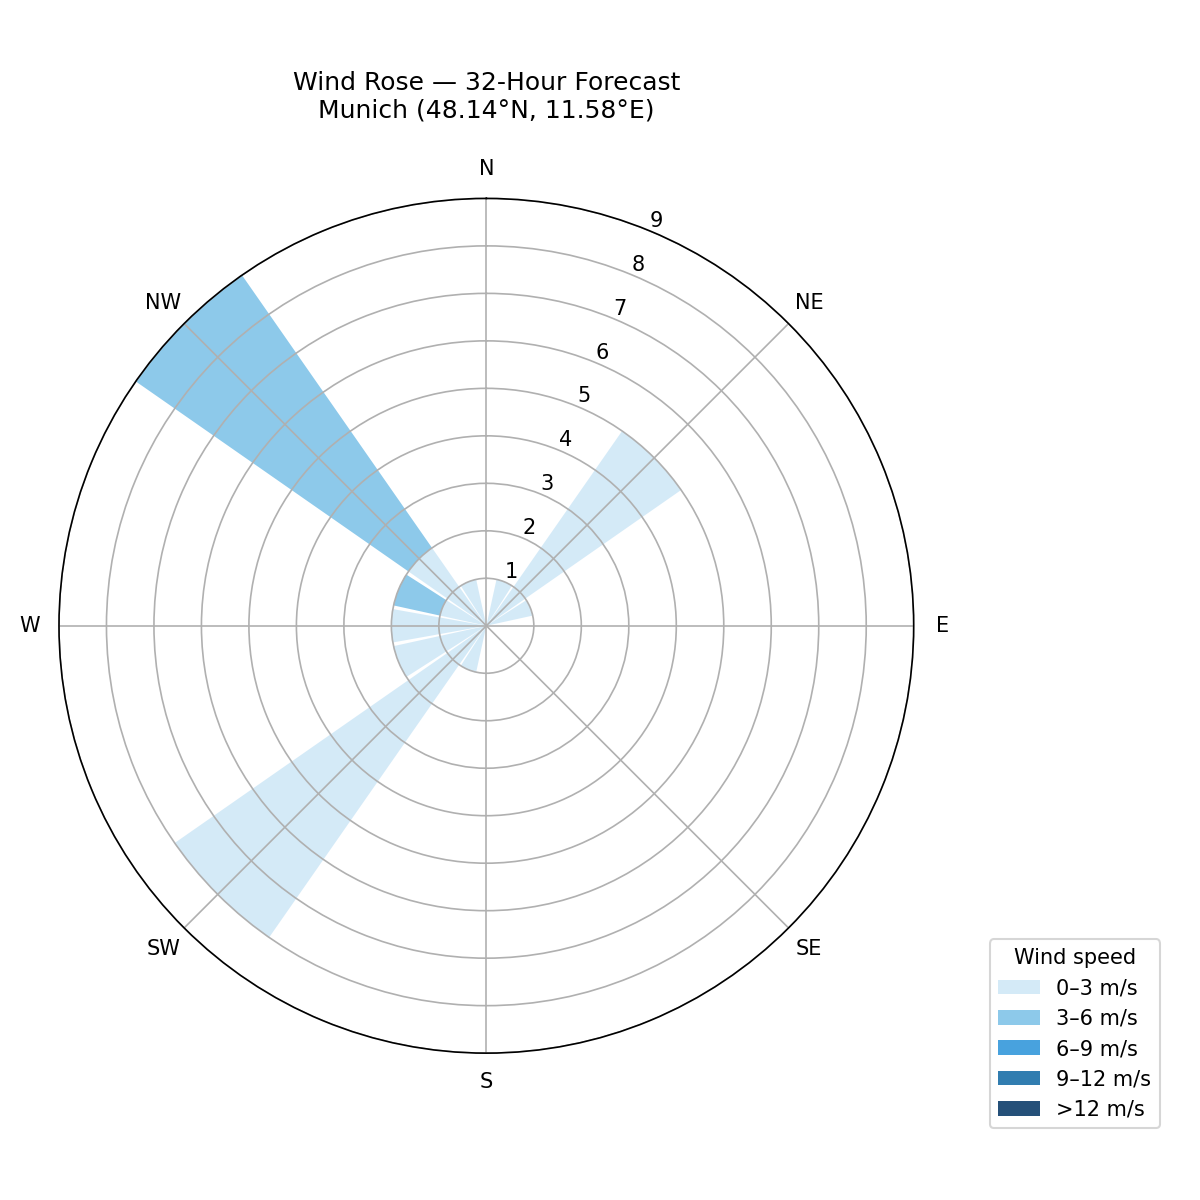 A wind rose is a polar chart that visualizes the distribution of wind directions and speeds over a period of time — useful for understanding prevailing wind patterns at a location.
Code Snippet
The code fetches 48 hourly forecast items and bins each reading by wind direction (16 compass sectors) and wind speed (five Beaufort-style bands). Each concentric ring on the chart represents one hour counted in that sector/speed combination.
wind_rose.py
import matplotlib.pyplot as plt
import numpy as np
import os
import requests

RAINBOW_API_TOKEN = os.getenv("RAINBOW_API_TOKEN")

# Put your location here (London)
LON = -0.1278
LAT = 51.5074

url = (
    f"https://api.rainbow.ai/weather/v1/forecast/{LON}/{LAT}"
    f"?forecast_hours=48&token={RAINBOW_API_TOKEN}"
)
data = requests.get(url).json()

hourly = data["timelines"]["hourly"]
directions = [h["windDirection"] for h in hourly]
speeds = [h["windSpeed"] for h in hourly]

# Bin directions into 16 compass sectors (22.5° each)
num_sectors = 16
sector_width = 360 / num_sectors
speed_bins = [0, 3, 6, 9, 12, float("inf")]
speed_labels = ["0–3", "3–6", "6–9", "9–12", ">12"]
colors = ["#d0e8f7", "#81c3e8", "#3498db", "#1a6fa8", "#0d3d6b"]

sector_counts = np.zeros((num_sectors, len(speed_labels)))
for direction, speed in zip(directions, speeds):
    sector = int((direction + sector_width / 2) % 360 / sector_width)
    for i in range(len(speed_bins) - 1):
        if speed_bins[i] <= speed < speed_bins[i + 1]:
            sector_counts[sector][i] += 1
            break

angles = np.linspace(0, 2 * np.pi, num_sectors, endpoint=False)
width = 2 * np.pi / num_sectors

fig, ax = plt.subplots(figsize=(8, 8), subplot_kw={"projection": "polar"})
ax.set_theta_zero_location("N")
ax.set_theta_direction(-1)

bottom = np.zeros(num_sectors)
for i, (label, color) in enumerate(zip(speed_labels, colors)):
    counts = sector_counts[:, i]
    ax.bar(angles, counts, width=width * 0.9, bottom=bottom,
           color=color, label=f"{label} m/s", alpha=0.9)
    bottom += counts

ax.set_xticks(np.linspace(0, 2 * np.pi, 8, endpoint=False))
ax.set_xticklabels(["N", "NE", "E", "SE", "S", "SW", "W", "NW"])
ax.set_title(f"Wind Rose — 48-Hour Forecast\n({LAT}, {LON})", pad=20)
ax.legend(loc="lower right", bbox_to_anchor=(1.3, -0.1), title="Wind speed")

plt.tight_layout()
plt.show()
Run
Install dependencies and set your API token:
Bash
pip install matplotlib numpy requests
export RAINBOW_API_TOKEN=<your-api-key>
python wind_rose.py